
Executive Snapshot
Initial Investment Thesis
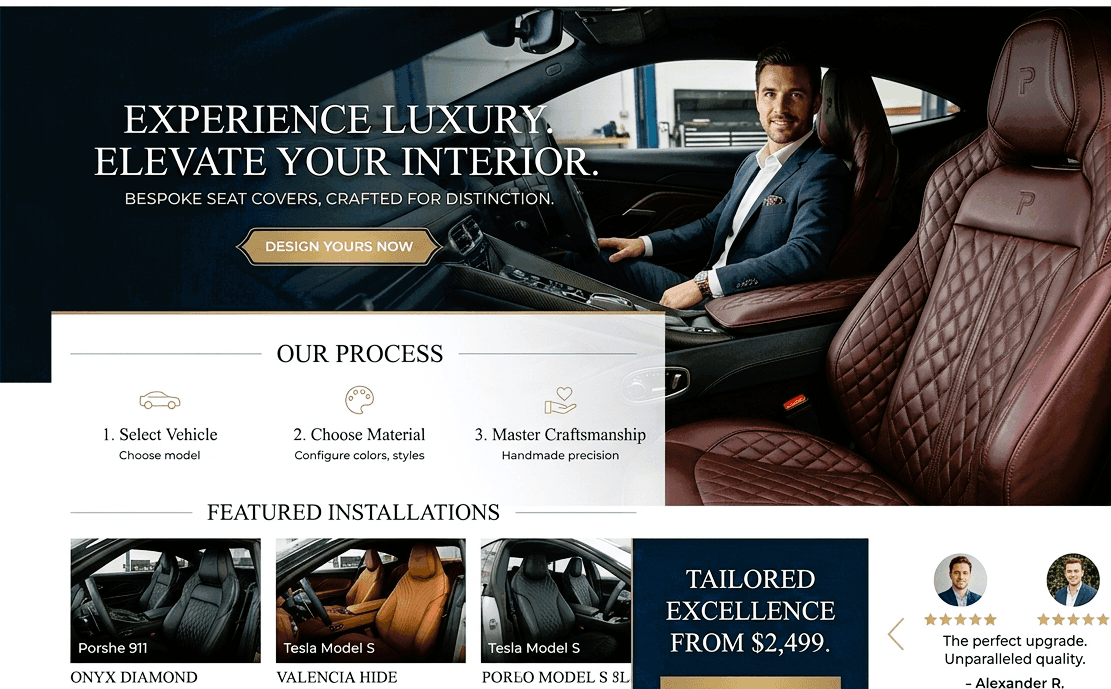
A differentiated, high-AOV ($430–$500) custom automotive brand with defensible operational advantages (VIN-based precision ordering, complex-seat capability, and phone sales infrastructure driving 35–40% of revenue). Strong paid media engine already built, team in place, and clear levers for scale (SEO, content expansion, material diversification, CVR optimization).
Initial Concern Flags
Heavy reliance on paid traffic (Meta + Google only), low conversion rate (0.6–0.7%), and fully made-to-order custom production from China create operational and margin risk. Business also depends meaningfully on phone-based abandoned cart recovery and specific supplier relationships.
Market & Demand Signals
Category Overview
Custom automotive seat covers sit within the broader automotive aftermarket industry, which historically performs well due to long vehicle lifespans and owner personalization trends. This brand focuses on high-ticket, custom-fit leather covers — a premium niche within a large, fragmented market dominated by universal-fit, lower-quality options.
Market Size & Growth Trajectory
The U.S. automotive aftermarket exceeds $400B annually, with interior accessories representing a stable sub-segment. Growth is driven by:
Increasing vehicle age (avg. vehicle age in U.S. continues rising)
High truck ownership rates
Strong used vehicle market
DIY and personalization culture
Premium customization is a smaller segment but structurally growing as consumers demand better fit and quality.
Search Demand & Keyword Indicators
Core keywords such as “custom seat covers,” “Ford F150 seat covers,” and “leather truck seat covers” are historically high-volume, evergreen searches. Demand is model-specific and SKU-driven (vehicle-based long-tail keywords), which supports scalable paid + SEO strategies. No indication this is a short-term viral trend category.
Seasonality vs Evergreen
Largely evergreen demand. Mild Q4 lift possible (holiday spending, gifting), but no extreme seasonal dependency. Vehicle ownership needs are constant.
Problem Urgency
Moderate urgency. Seat covers are not essential, but protective and restorative use cases (protecting new trucks, restoring older interiors, resale value) create rational purchase drivers. For truck owners and classic car enthusiasts, fit precision significantly increases perceived necessity.
Cultural/Macro Tailwinds
Rising vehicle prices → consumers maintain vehicles longer
Growth in truck/SUV ownership
Resale value preservation mindset
Increasing consumer skepticism toward generic “custom” claims (VIN-based differentiation is timely)
Regulatory Impact
Minimal regulatory risk. Standard consumer goods category.
Trend vs Timeless
Timeless category with consistent demand, not trend-driven.
→ Market Attractiveness Score: Strong
→ Demand Durability Assessment: High (Evergreen, model-driven, replacement + protection use cases)
Product–Market Fit Indicators
Goal: Does this solve a clear problem for a defined audience?
Value Proposition Clarity
Yes — the value proposition is clear and concise:
“Truly custom-fit leather seat covers (using VIN verification) that fully wrap and fit complex or hard-to-fit vehicle seats.”
The problem being solved is explicit: generic “custom” seat covers often do not fit properly. This brand addresses mistrust in the category by using VIN-level validation and accommodating complex seat types (integrated seatbelts, molded headrests, jump seats, vintage models).
Core Customer Persona
Primary segments include:
Truck owners (e.g., Ford F-150, heavy-duty pickups)
Classic/vintage vehicle owners
Owners of vehicles with complex seat configurations
Buyers seeking interior restoration or protection
High-intent shoppers comparing custom seat cover brands
Demographically: predominantly male, vehicle-proud, value durability and aesthetics, willing to spend $400–$600 for quality and precision.
Differentiation
Operational differentiation:
VIN-based validation (reduces fit errors)
Ability to produce covers for complex seat types
Capability for vintage and specialty vehicles
Phone-based abandoned checkout closing (35–40% revenue impact)
Product differentiation:
Full 360° wrap option
Compatibility with seat functions (cupholders, folding mechanisms)
There is no formal IP protection mentioned, so differentiation is execution-based rather than legally defensible. However, supplier relationships and systems create operational moats.
Commoditisation Risk
Moderate. Seat covers, as a category, are highly commoditized. However, the premium, high-complexity custom niche is less saturated and harder to execute operationally. Risk increases if competitors adopt VIN validation and similar fulfillment systems.
Ease of Customer Adoption
Moderate friction due to:
VIN submission
Potential measurement/photo requirements
High ticket price
Trust concerns around fit
However, phone support and guided assistance mitigate this friction. Low refund rate (0%) suggests high satisfaction or strong expectation setting.
Repeat Usage Potential
Low to moderate. This is primarily a one-time purchase per vehicle. Repeat purchases would depend on:
Multiple vehicle ownership
Upgrading to full custom
Material expansion (e.g., cloth variants)
No natural subscription/refill logic exists.
Price Positioning
Premium positioning.
AOV: $430–$500
COGS: ~$160
26% net margin
Justification for premium pricing includes full custom fit, leather material, VIN precision, and ability to fit complex seat structures competitors avoid.
Website & Conversion Infrastructure
Website Speed & UX Quality
Without direct speed audit data, the site appears built on Shopify with a relatively simple structure — generally supportive of stable performance. However, visible layout issues on the reviews page (which lacks actual content) suggest room for refinement. Key pages load product details, vehicle selectors, and ordering steps cleanly, but conversion-focused elements could be more intuitive.
UX strengths:
Clear vehicle selector for custom orders
VIN / configuration-driven flow supports personalization
Multiple product options presented logically
Warranty and fit info emphasized in product pages
UX weaknesses:
Lack of visible review content on main site
Pages like “Customer Reviews” show static placeholder text without reviews
Mobile Optimization
Likely good (Shopify standard), but no real mobile audit available. Given heavy paid ad traffic, mobile UX must be prioritized; any lag or confusion here could depress conversion.
Visual Credibility & Brand Consistency
The visual style is fairly consistent: professional photography of seat covers, detailed product text, and warranty/fit guarantees. However, brand visuals are relatively generic with limited unique identity cues beyond product shots — this represents a mild credibility gap versus higher-end automotive accessory brands.
SKU Count & Catalog Structure
The catalog covers:
Standard custom seat covers
Full custom seat covers
Floor mats and interior packages
Each SKU uses vehicle and configuration selectors. The structure supports personalization but isn’t overly broad — appropriate for a custom product niche. Bundles (front + back seats) are supported with savings indicated, helping average order size.
AOV (Average Order Value)
Reported around $430–$500, which is solid for a premium seat cover product.
Estimated Conversion Rate
Stated industry data from the business suggests a conversion range ~0.6–1%, which is low but still profitable given the high AOV.
Upsell / Cross-Sell Structure
Some bundling logic exists (e.g., seat cover set discounts), but upsell tactics like complementary products (floor mats, interior makeover) could be more prominent and integrated at checkout and product pages. Opportunities here are unleveraged.
Trust Signals (Reviews, Certifications, UGC)
Weakest area.
Trustpilot shows zero reviews (a 0 score by default) — no social proof from that channel. (Trustpilot)
No visible third-party certifications or badges.
On-site reviews appear generic or potentially self-curated rather than verified (images and quotes).
Public social profiles exist but with limited follower count and content activity (Instagram ~1.7K followers with ~50–60 posts) suggesting modest engagement.
This is a significant gap especially in a high-ticket category where trust can make or break conversions.
Technical Issues Visible Publicly
“Customer Reviews” page exists but has no actual reviews displayed.
Occasional loading issues or unclear imagery reduction on some pages.
VIN and configuration inputs must work flawlessly — any UX bugs here would kill completion but are not publicly visible.
Checkout Flow Friction
Custom orders involve multiple steps (select year, make, model, seat type, colors) — necessary but potentially friction-inducing. The presence of phone support and abandoned checkout calls mitigates some friction, but the checkout timeline (VIN input, measurements, photos for complex orders) creates conversion resistance not fully addressed by UX incentives.
Traffic & Distribution Footprint
Goal: Where does demand actually come from?
Estimated Traffic Volume
Based on Shopify data provided:
1,100 orders
~$549,924 in revenue
AOV ~$500
Conversion rate stated between 0.6%–1%
Using a blended estimated CVR of ~0.7%, this implies approximate annual traffic of:
1,100 orders ÷ 0.007 ≈ 157,000–180,000 sessions annually
(~13,000–15,000 monthly visitors)
This suggests moderate but highly monetized traffic due to high AOV.
Primary Channels
Paid acquisition is the dominant driver.
All sales are generated from:
Facebook (Meta Ads)
Google Ads
There is currently:
No meaningful SEO contribution
No marketplace presence
No organic engine highlighted
No Amazon / Etsy channel
No wholesale or B2B distribution
The business is therefore 100% paid-media driven.
Channel Concentration Risk
Very high concentration risk.
Two ad platforms drive essentially all revenue:
Meta (Facebook)
Google
Additionally:
35–40% of monthly revenue comes from abandoned checkout phone calls.
This creates a dual dependency:
Paid ad lead flow
Phone sales team converting abandoned carts
If paid traffic slows, the phone sales pipeline shrinks proportionally.
There is no evidence of:
Email-driven repeat revenue
Organic search pipeline
Influencer engine
Affiliate program
Retail presence
This makes revenue acquisition fragile but controllable (through ad spend).
Platform Dependency Risk
Meta + Google dependency is high.
Risks include:
CPM inflation
Account bans or restrictions
Policy changes
Ad creative fatigue
Increasing CAC
However, the business benefits from:
High AOV ($430–$500)
26% margin
Backend phone closing (7% close rate)
This provides more cushion than lower-ticket e-commerce models.
The ad agency charges a percentage of sales, which aligns incentives but creates cost variability tied to performance.
No TikTok, Pinterest, or YouTube diversification is mentioned.
International vs Local Reach
The primary market appears to be the United States.
The business is based in Florida.
Shipping is handled from China with 7-day shipping times (implies U.S.-focused fulfillment routes).
No indication of strong international expansion yet.
Potential exists to expand into Canada, Australia, UK (truck markets), but currently appears U.S.-centric.
SEO Footprint Strength
Explicitly stated:
“SEO hasn't been utilized at all yet.”
This is a major gap.
Given:
Vehicle-specific long-tail keywords (e.g., model + seat covers)
High-intent search behavior
Poor reviews from competitors (opportunity for comparison content)
SEO represents a strong unrealized acquisition lever.
At present, organic presence should be considered weak to minimal.
Marketplace Presence
No Amazon, eBay, Etsy, or other marketplace footprint mentioned.
This keeps brand positioning premium and controlled but limits distribution diversification.
Entering Amazon would:
Increase exposure
Compress margins
Reduce brand control
Increase commoditization pressure
Currently, the brand remains fully DTC.
Direct vs Intermediary Sales Ratio
Appears to be 100% direct-to-consumer via the owned Shopify store.
No wholesale
No dealer network
No marketplaces
No retail presence
Phone sales operate within the DTC funnel (not external distribution).
Structural Observations
Strengths:
High AOV supports aggressive paid acquisition
Strong backend monetization (phone closer system)
Dedicated creative + editing team
Established ad systems
Hands-off fulfillment process
Abandoned checkout recovery significantly increases LTV per lead
Weaknesses:
No owned traffic channel (SEO, content, YouTube, community)
No recurring revenue mechanism
No diversified ad platform mix
Revenue tightly tied to ad performance
The model is performance-marketing optimized rather than brand-compound optimized.
There is significant upside potential in:
SEO expansion
Content marketing
YouTube vehicle-specific reviews
Influencer partnerships (automotive niche)
Retargeting email/SMS sequences
International scaling
The infrastructure exists to scale — but distribution remains concentrated and performance-dependent.
Marketing & Customer Acquisition
Goal: Is growth engineered or improvised?
Paid Ad Presence
All revenue is generated through Meta (Facebook) and Google Ads, indicating a performance-driven acquisition model. The presence of a dedicated creative director, video editor, and performance-based ad agency suggests structured paid media execution rather than casual ad boosting.
However, channel concentration is high. There is no evidence of TikTok Ads, YouTube Ads, affiliate marketing, or marketplace-driven acquisition. Growth currently depends almost entirely on two platforms.
Creative Sophistication Level
Moderate to strong.
The business employs:
A Creative Director (concept ideation and briefs)
A Video Editor (production execution)
UGC-style content (limited library)
This suggests structured creative testing. However:
Content library is limited
Specialty differentiation (integrated seatbelts, molded headrests, classic cars) has not yet been fully leveraged in ad storytelling
Heavy reliance on founder-shot content creates brand bottleneck risk
Creative sophistication is operationally organized but underdeveloped in narrative depth.
Funnel Depth
This is where the brand stands out.
Key differentiator: phone-based abandoned cart recovery.
Leads exported daily into GoHighLevel (GHL)
7% close rate
35–40% of monthly revenue attributed to this channel
This indicates:
Strong backend monetization
Structured CRM usage
Multi-touch sales approach
However, funnel depth outside phone calls appears limited. There is no mention of:
Lead magnets
Educational content funnels
Pre-purchase email nurturing sequences
Advanced retargeting segmentation
The funnel is conversion-focused rather than brand-building focused.
Email List Size
Disclosed email subscribers: 6,665
For ~13,000+ customers and ~157,000+ annual visitors, this list is moderate but underleveraged. There is no indication of strong email revenue contribution. Email currently appears to function more as a database than a revenue engine.
Organic Social Engagement
Public social accounts exist (Instagram, Facebook), but engagement levels appear modest relative to revenue scale.
There is no evidence of:
Strong community engagement
Consistent viral or high-engagement content
Educational long-form automotive content
Organic presence appears supportive rather than demand-driving.
UGC Density
Limited but present.
Given the high-ticket nature and strong product visuals, this category is well-suited for:
Before/after installs
Owner testimonial videos
Installation walkthroughs
Fit validation proof
Currently, UGC depth appears insufficient relative to the trust required for a $500 purchase.
Influencer Presence
No structured influencer program mentioned.
Automotive niche influencers (truck channels, restoration channels, detailing creators) represent an obvious but currently untapped acquisition layer.
CAC Indicators
Exact CAC is not disclosed.
However:
AOV: ~$430–$500
COGS: ~$160
Net margin: ~26%
Consistent $10k+ monthly profit
This implies CAC is currently sustainable but likely meaningful, given paid-only traffic and low CVR (0.6–0.7%).
The low CVR suggests acquisition efficiency could materially improve through conversion optimization and trust enhancement.
Scalability Signals
Strong scalability signals:
Proven paid acquisition engine
Structured creative team
CRM + phone sales backend
Outsourced ad agency scaling performance
Hands-off fulfillment
Major upside levers:
Increase CVR from 0.7% to 1%+
Add SEO
Expand content depth
Introduce non-leather materials
Diversify paid channels
Launch influencer partnerships
The model has growth levers, but they are not yet fully engineered.
LTV Indicators
Low natural repeat rate (seat covers are typically one-time purchases per vehicle).
However, LTV can be enhanced through:
Multi-vehicle ownership
Cross-sells (floor mats, interior packages)
New material launches
Upselling from partial to full custom
Currently, LTV appears primarily transaction-based rather than lifecycle-optimized.
Monetisation & Unit Economics (Surface-Level)
Goal: Does the math look structurally viable?
Pricing Strategy
The brand operates with a premium pricing strategy positioned around precision fit, leather material, and complex-seat compatibility. The offer is differentiated on quality and technical capability rather than price leadership.
Two pricing tiers exist:
Standard Custom Fit (partial back coverage, lower production complexity)
Full Custom Fit (360° wrap) (higher complexity, premium pricing)
This tiered structure supports value-based pricing and segmentation of budget-sensitive vs premium buyers.
AOV
Reported AOV: $430–$500
This is strong for an automotive accessory category and supports paid acquisition economics. High ticket size allows the business to absorb paid traffic costs and still maintain profitability.
Product Price Bands
While exact price bands are not disclosed, inferred range appears to be:
~$350–$600 depending on seat configuration and customization level
Given:
Average COGS ≈ $160
Reported net profit margin ≈ 26%
Consistent $10k/month profit
The pricing structure supports both paid acquisition and operational overhead.
Implied Gross Margin
Assuming:
AOV ≈ $430
COGS ≈ $160
Implied gross margin before ad spend ≈ 63%
After marketing and operational costs, net margin sits around 26%, which is healthy for a paid-traffic DTC model in a custom product category.
This indicates structurally viable unit economics, provided CAC remains stable.
Bundles/Upsell Logic
Current monetization structure appears relatively simple:
Front + rear seat configurations
Standard vs Full Custom
Some bundling exists but appears under-optimized.
Opportunities include:
Interior package bundles
Floor mats cross-sell
Installation accessories
Premium material upgrades
Express production upgrade
Upsell logic exists but is not fully maximized.
Return/Refund Signals
Refund rate reported at 0%, which is unusually strong for a custom product category.
This suggests:
Good expectation setting
Accurate VIN-based fit validation
Strong post-purchase support
However, lack of third-party review depth makes independent verification difficult. Still, operationally this is a positive signal.
Subscription Logic
There is no natural subscription model.
Seat covers are:
Non-consumable
Long lifecycle products
Vehicle-specific
Repeat purchase relies on:
Multi-vehicle ownership
Vehicle replacement
Upgrading to full custom
No built-in recurring revenue mechanism.
Margin Expansion Potential
Several levers exist:
Bulk production for top vehicle SKUs
Could reduce per-unit COGS significantly.Material diversification (non-leather)
Lower material cost SKUs for hot-climate markets.Conversion rate optimization (0.6–0.7% → 1%+)
Would dramatically increase contribution margin.SEO acquisition
Reduces blended CAC and improves net margin.Operational refinement of custom workflows
Standardization for top-selling vehicles.
Margin expansion appears feasible without changing pricing.
Brand Strength & Perception
Brand Consistency
The site, product positioning, and messaging are consistent around one core theme: “truly custom fit.” The VIN-based validation and complex-seat compatibility reinforce this positioning. Social channels exist but are modest in depth and engagement. Brand visuals are clean but not iconic.
Emotional Positioning
Primarily functional with confidence-based reassurance.
The purchase driver is accuracy, fit, and protection—not aspiration or status. There is some pride-of-ownership appeal (truck/classic car owners), but branding is not yet aspirational or lifestyle-led.
Storytelling Depth
Moderate but underdeveloped. The origin story (gap in poorly fitting covers) is clear. However, differentiation around integrated seatbelts, molded headrests, and classic cars has not been fully leveraged in long-form content or storytelling assets.
Founder Visibility
Founder-led narrative present. However, some marketing content relies on founder-created videos (not transferable), creating minor brand continuity risk post-sale.
Review & Trust Signals
0 Trustpilot reviews
Limited third-party validation
Refund rate reported at 0%
Trust infrastructure is weak relative to ticket size.
Community & Press
No meaningful press, certifications, or strong community layer visible.
Brand Defensibility
Operational differentiation (VIN validation + complex seat coverage) is the primary moat. No IP protection. Brand equity is emerging but not yet entrenched.
→ Brand Asset Strength: Moderate (Product-forward, not yet brand-driven)
→ Reputation Risk Flags: Lack of third-party reviews, limited social proof, founder-content dependency.
Competitive Landscape
Seat covers are a crowded category with many generic and mid-tier competitors. However, the true custom leather niche for complex seats is narrower.
Competitive Dynamics
Many universal-fit sellers
Few high-complexity fit specialists
Limited players handling vintage or integrated seatbelt seats
Pricing tiers range from $100–$600+. FCC sits at the premium end.
Switching Cost
Moderate psychological switching cost once VIN and measurements are submitted. Low physical switching cost pre-purchase.
Barriers to Entry
Low for generic sellers. Higher for:
Complex seat mapping
Supplier coordination
VIN validation workflows
Phone-based backend sales
Not race-to-the-bottom, but commoditization risk exists if others replicate systems.
→ Competitive Intensity Rating: Moderate-High
→ Positioning Gap Opportunities: Own the “fit guaranteed” authority position with education + comparison SEO.
Operational Complexity (Inferred)
SKU Complexity
High variability due to vehicle-specific customization.
Supply Chain
Custom factory in China; appears relationship-based. Likely single-supplier concentration risk.
Fulfillment
Made-to-order + 7-day shipping. Complex but systemized.
Returns
Reported 0% refund rate; operationally positive.
Cash Flow
No bulk inventory held (dropship model), reducing inventory burden but increasing per-unit COGS.
→ Operational Risk Score: Moderate
→ Scalability Friction Points: Supplier reliance, customization workflow complexity, phone sales dependence.
Risk & Fragility Signals
100% paid traffic dependency
35–40% revenue from phone recovery
No SEO engine
Low CVR (0.6–0.7%)
No structural IP moat
→ Fragility Index: High-Moderate
Top 3 Structural Risks:
Platform dependency (Meta/Google)
Supplier concentration
Weak trust infrastructure for high-ticket category
Growth Levers (Externally Visible)
SEO Domination for vehicle-specific and comparison keywords
Material Expansion (cloth options for hot climates)
Bulk production of top SKUs to improve margins
Influencer partnerships in truck/classic niches
Conversion rate optimization to 1%+
Founder & Operator Signals
This appears system-driven rather than hobby-driven.
Team in place: support rep, closer, creative director, editor, ad agency, fulfillment manager.
Owner claims 1 hour/day involvement.
Over-reliance on founder face in some creative, but not structurally dependent on founder for operations.
→ Operator Dependency Risk: Moderate-Low (systems exist, but creative identity partly founder-tied)
Exit & Optionality Signals
Strategic buyer appeal:
Automotive accessory roll-up
Performance marketing operators
Amazon aggregators expanding into DTC
Multiple expansion possible if:
SEO added
CVR improved
Margin increased
What improves with scale:
Supplier leverage
Brand authority
Content moat
What worsens:
Ad cost inflation exposure
→ Exit Attractiveness Score: Moderate-High
“Unfair Advantage” Check
Hard-to-copy elements:
VIN-based workflow
Complex seat mapping
Backend phone closing system
Supplier relationship
Replicable within 12 months by capable operator, but not instantly.
No IP, no community moat, no proprietary data moat yet.
Financial Snapshot (Preliminary Review)
Revenue: ~$550k
Profit: ~$134k annualized
Margin: 26% net
Multiple: 2.1x profit
Revenue appears consistent with Q4 spike.
Low refund rate supports stability.
Valuation is reasonable for a paid-traffic DTC asset.
Appears moderately optimized for sale (clear systems narrative).
Key Unknowns to Validate
Last 6 months revenue breakdown
True blended CAC & ROAS
Exact gross margin after shipping
Phone sales CAC vs ad CAC
Supplier contract security
Ad account health
Chargeback rate
Detailed reason for exit
Customer acquisition cost trend
Production bottleneck constraints
Preliminary Verdict
Opportunity Level: Moderate to High
Risk Level: Moderate-High (platform concentration risk)
Investment Profile:
Performance-driven cash-flow asset with brand build upside.
Best suited for:
Operator who can add SEO + brand authority
Buyer comfortable managing paid acquisition
Potential roll-up candidate in automotive niche
Not yet a deep brand moat — but structurally profitable with scalable upside.